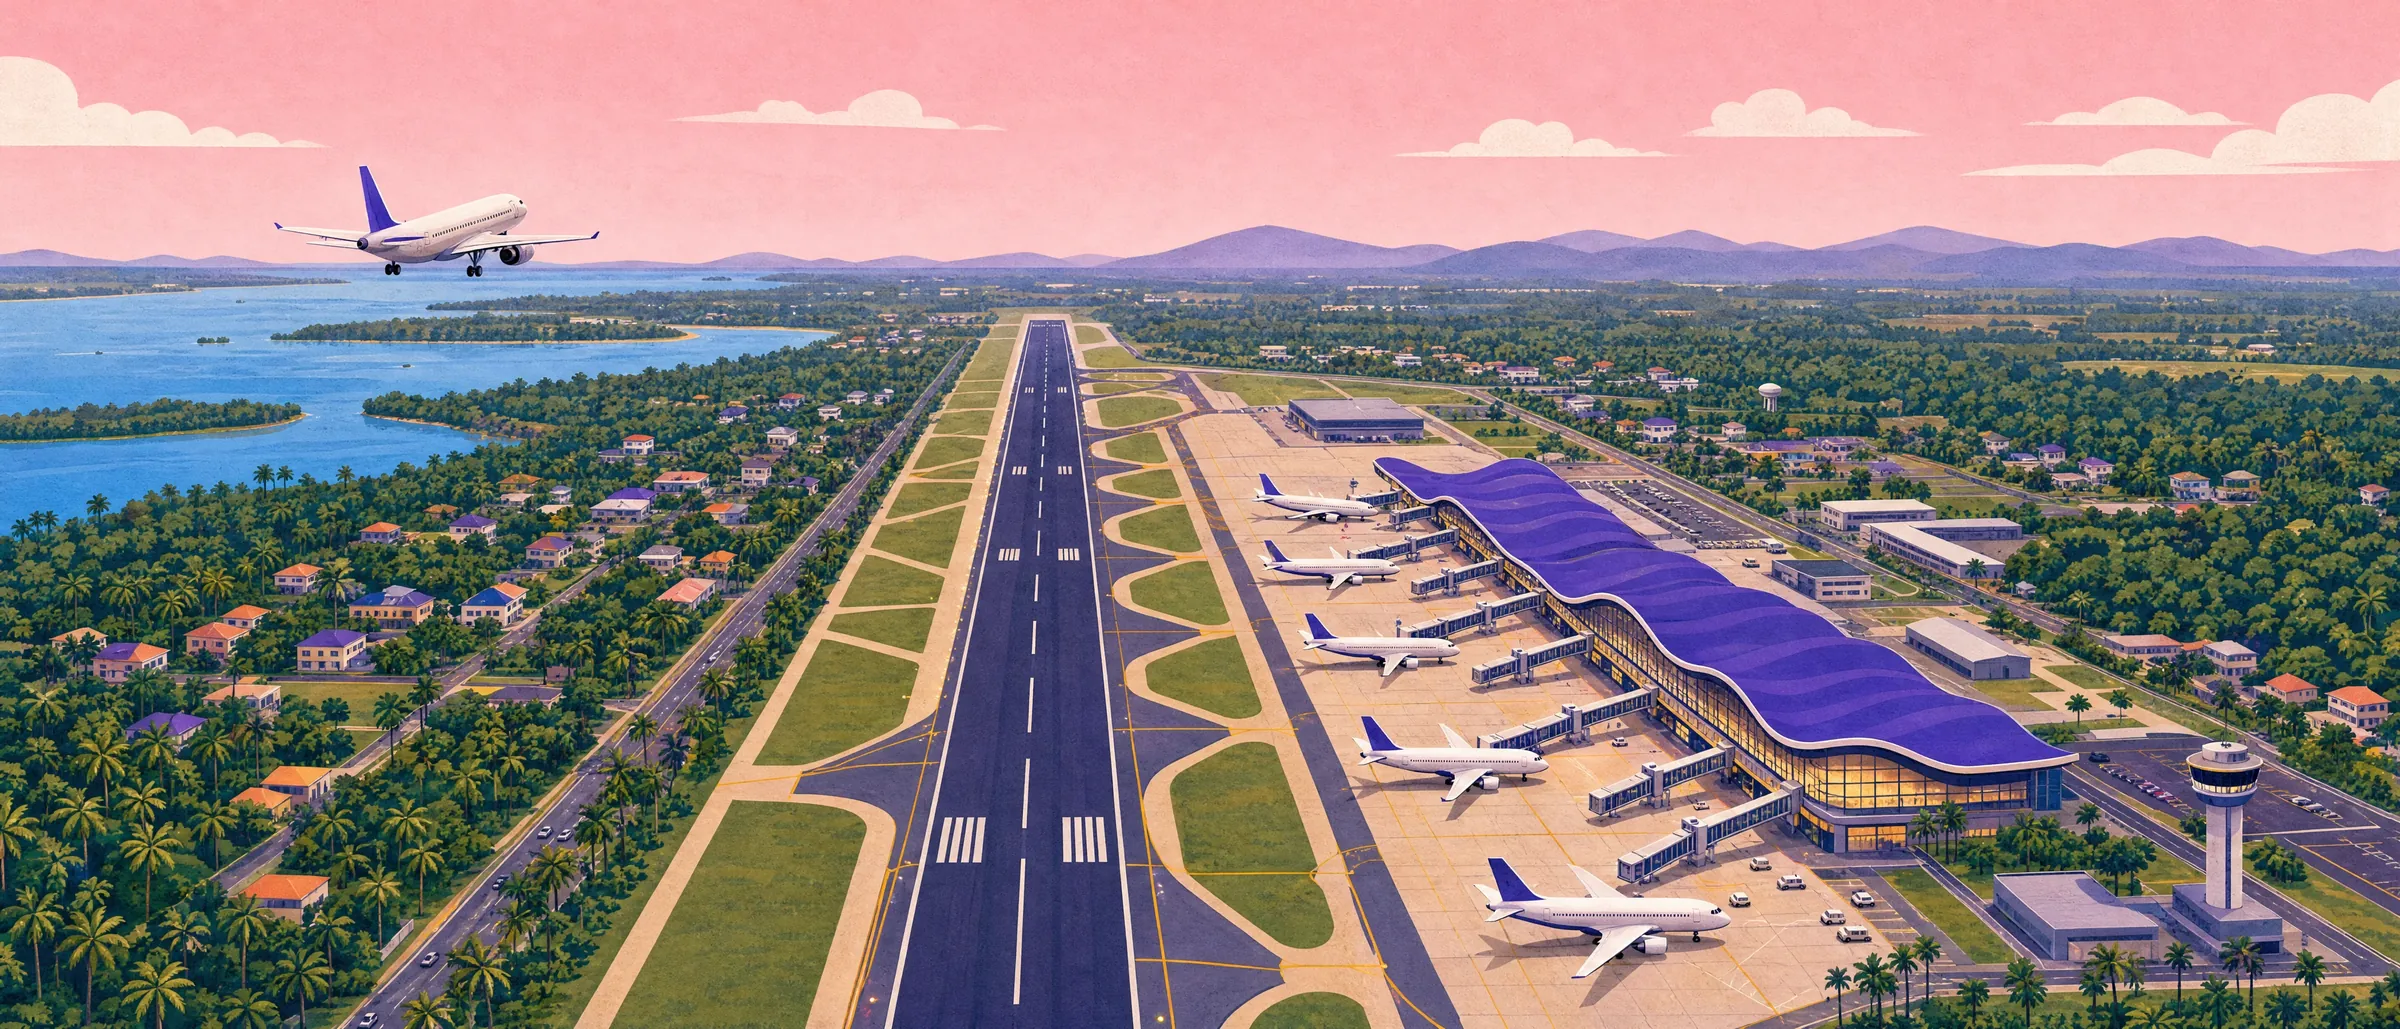
10 million passengers, 6 million terminal
Bandaranaike International Airport (BIA) handled about 10 million passengers in 2025 in a terminal designed for 6 million.
About 40% more runway capacity
Runway capacity can rise by about 40% without a second runway.
Terminal 2 full in about four years
Terminal 2 will be full within about four years of opening.
Protect second runway land now
A second runway is a 2040s requirement for capacity, but the land must be protected now, and it must be far enough from the first to work independently.
Executive summary
Bandaranaike International Airport (BIA) handled about 10 million passengers in 2025 in a terminal designed for 6 million. This report asks what should be built, in what order, to carry the traffic the tourism targets imply.
Findings
- The runway is long enough but slow to clear. It is 3,350 m long with five exit taxiways, all at 90 degrees. There is no rapid exit taxiway. A landing aircraft occupies the runway for roughly twice as long as it would with one.
- Runway capacity can rise by about 40% without a second runway. Mumbai raised its declared capacity from 32 to 44 movements an hour by adding rapid exits. Gatwick has handled 55 an hour on one runway.
- Terminal 2 will be full within about four years of opening. On the central forecast, traffic reaches 15 million a year in 2032.
- A second runway is a 2040s requirement for capacity, but the land must be protected now, and it must be far enough from the first to work independently.
- Ground handling has a single provider. Turnaround performance is not published.
- Jaffna is limited by its 1,400 m runway, which restricts it to aircraft of about 75 seats.
Principal recommendations
- Build four rapid exit taxiways and introduce reduced approach spacing, targeting a declared capacity of 30 movements an hour by 2028 and 44 by 2032.
- Design Terminal 2 as the first of two phases. Add 12 contact gates by 2034 and 8 more by 2040.
- Gazette a corridor for a second runway at least 1,035 m from the first. Upgrade the parallel taxiway to a standby runway by 2030.
- License a second ground handler before Terminal 2 opens.
- Extend the expressway about 8 km to Negombo and restore the airport rail service.
- Extend the Jaffna runway to 2,300 m within the existing airfield as far as possible.
US$860 m
Indicative programme cost, 2026 to 2035, excluding Terminal 2 and a second runway
US$70 m
The airfield package that delivers most of the runway gain

1 Purpose, scope and method
1.1 Purpose
Tourism is central to Sri Lanka’s economic plans. Arrivals reached a record 2.36 million in 2025, with targets of 3 million for 2026 and 4 million by 2030.6 7 Almost all visitors arrive by air through one airport.
This report assesses whether that airport, and the wider network of airports, roads and ferry routes, can carry the traffic those targets imply, and sets out development options.
1.2 Scope
- Airfield: runway, taxiways and air traffic procedures at BIA.
- Terminal: gates, stands and passenger processing.
- Operations: ground handling.
- Surface access: road and rail to Colombo and Negombo.
- Network: Jaffna, other domestic airports and ferry routes to India.
1.3 Method
The report uses published traffic statistics, airport project documents, press reports and international design standards. Forecasts are scenario based. Runway capacity is estimated from first principles and checked against airports that operate a single runway.
Costs are order-of-magnitude estimates for planning. They are not based on design or tender prices.
1.4 Limitations
No site survey, aeronautical study or consultation with the airport operator was carried out. Full-year 2025 figures are estimated from eight months of data. Every assumption is stated in Appendix A.
Terms used in this report
- ATM: Air traffic movement. One landing or one take-off.
- Declared capacity: The number of movements an hour the airport commits to handle, used for scheduling.
- ROT: Runway occupancy time. Seconds from crossing the threshold to being clear of the runway.
- RET: Rapid exit taxiway. An exit set at a shallow angle so aircraft can leave the runway at speed.
- Threshold: The start of the part of the runway usable for landing.
- Separation: The minimum distance or time air traffic control keeps between two aircraft.
- Contact gate: A parking stand joined to the terminal by a passenger boarding bridge.
- Remote stand: A parking stand reached by bus.
- Apron: The paved area where aircraft park, load and refuel.
- mppa: Million passengers per annum.
- Mixed mode: One runway used for both landings and take-offs.
2 Existing conditions
2.1 Airfield
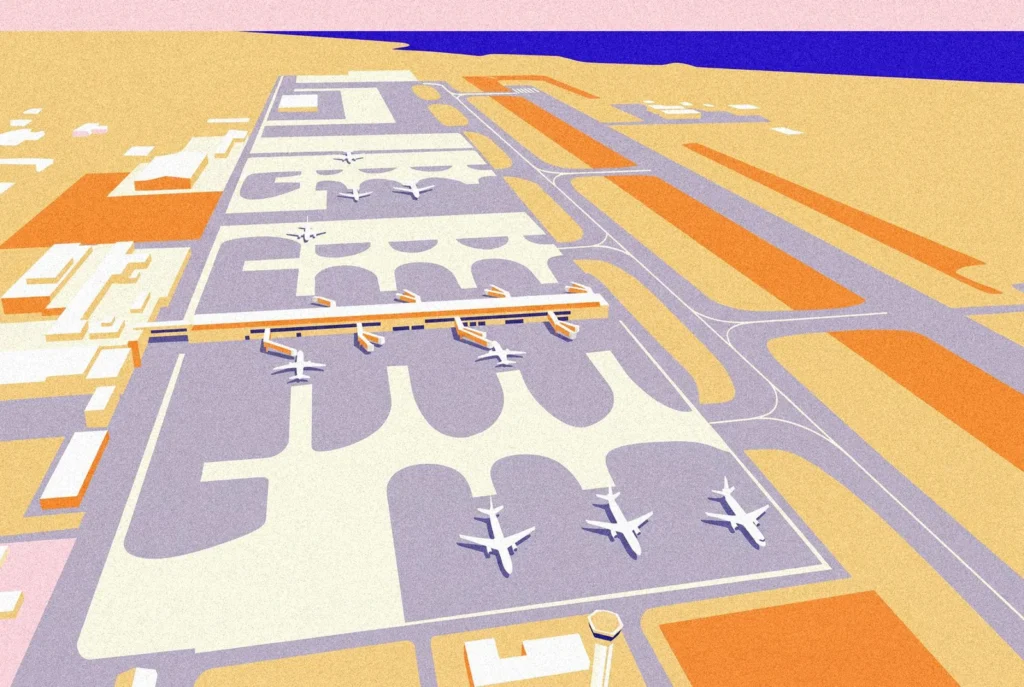
BIA has one runway, designated 04/22. It is 3,350 m long and 45 m wide, with a parallel taxiway of the same length set 200 m from the runway centreline.3
Five taxiways connect the runway to the parallel taxiway. All five meet the runway at 90 degrees.3 There is no rapid exit taxiway. Runway 22 has Category II approach lighting and runway 04 has Category I.3
2.2 Terminal and apron
Terminal 1 opened in 1967. It has 12 gates. A pier with eight passenger boarding bridges was added in 2005.1 5 There are 46 aircraft stands on five aprons.1 The terminal was designed for 6 million passengers a year.4
Table 1. Principal facilities
| Facility | Detail |
|---|---|
| Runway 04/22 | 3,350 m x 45 m |
| Parallel taxiway | Full length, 200 m offset |
| Runway exits | 5, all at 90 degrees |
| Rapid exit taxiways | None |
| Aircraft stands | 46 |
| Passenger boarding bridges | 8 |
| Terminal design capacity | 6 mppa |
| Immigration counters | About 225 |
Terminal 2, funded by a Japanese loan, started in December 2020 and stopped in 2022 at about 6% complete. It was re-tendered from September 2024.4 The 2026 budget expects work to resume in early 2026.6
3 Traffic
3.1 Recent traffic
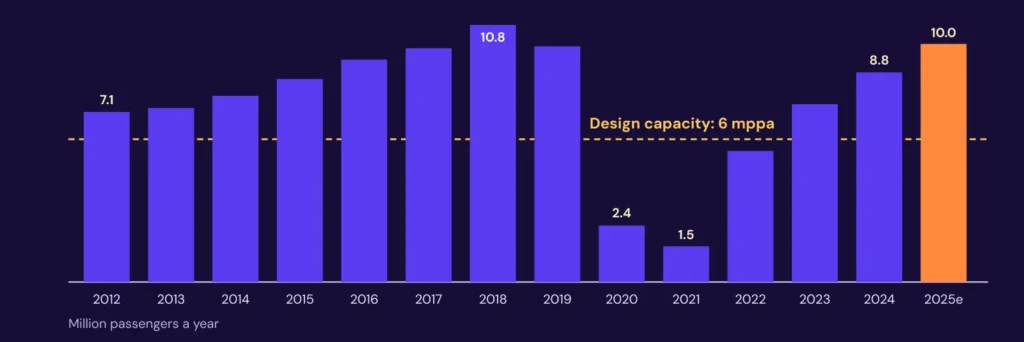
Traffic peaked at 10.8 million passengers in 2018. It fell after the 2019 Easter attacks, collapsed during the pandemic and recovered to 8.8 million in 2024.1
From January to August 2025 the airport handled 6,630,728 passengers, 13.6% more than in the same months of 2024.2 Applying that growth to the full year gives about 10.0 million for 2025.
Aircraft movements were 55,848 in 2024, or 158 passengers per movement.1 On the same basis 2025 movements are estimated at about 63,000.
Table 2. Traffic indicators
| 2018 | 2024 | 2025e | |
|---|---|---|---|
| Passengers, million | 10.80 | 8.80 | 10.0 |
| Aircraft movements | 67,158 | 55,848 | 63,000 |
| Passengers per movement | 161 | 158 | 158 |
| Movements per day | 184 | 153 | 173 |
| Share of terminal design capacity | 180% | 147% | 167% |
From 2012 to 2018 passengers grew at 7.1% a year.1 India is the largest visitor market, with 531,511 arrivals in 2025, or 22.5% of the total.7
4 Demand forecast
Three scenarios are projected from the 2025 estimate of 10.0 million passengers. They bracket the range from slow recovery to the growth implied by the national tourism targets.
Table 3. Passenger forecast, million passengers a year
| Scenario | 2025e | 2028 | 2030 | 2032 | 2035 | 2040 | 2045 |
|---|---|---|---|---|---|---|---|
| Low, 3.5% a year | 10.0 | 11.1 | 11.9 | 12.7 | 14.1 | 16.8 | 19.9 |
| Central, 5.5% a year | 10.0 | 11.7 | 13.1 | 14.5 | 17.1 | 22.3 | 29.2 |
| High, 7.5% a year | 10.0 | 12.4 | 14.4 | 16.6 | 20.6 | 29.6 | 42.5 |
The high scenario is close to the 7.1% a year recorded from 2012 to 2018. The central scenario allows for shocks of the kind seen since 2019.
2032
Central scenario reaches 15 mppa, the combined capacity planned for Terminals 1 and 24
2030
High scenario reaches 15 mppa
2037
Low scenario reaches 15 mppa
Table 4. Derived requirements, central scenario
| 2025e | 2030 | 2035 | 2040 | 2045 | |
|---|---|---|---|---|---|
| Passengers per movement | 158 | 162 | 166 | 170 | 175 |
| Aircraft movements a year | 63,000 | 81,000 | 103,000 | 131,000 | 167,000 |
| Movements on an average day | 173 | 222 | 282 | 359 | 457 |
| Peak hour movements | 12 to 16 | 16 to 20 | 20 to 26 | 26 to 33 | 33 to 42 |
| Contact gates required | 15 | 20 | 26 | 34 | 45 |
| Aircraft stands required | 41 | 45 | 50 | 57 | 65 |
Peak hour is taken as 1/14 of the average day for a spread schedule and 1/11 for a schedule with sharp night peaks. Contact gates at one per 650,000 annual passengers. Stand and gate methods are in Appendix A.
5 Runway capacity
5.1 What limits a single runway
Only one aircraft may be on a runway at a time. Capacity is therefore set by two times, and the longer of the two governs.
Separation time. Controllers keep a minimum distance between aircraft on final approach. The time between two landings is that distance divided by approach speed.
time between landings = separation distance / approach speed
Runway occupancy time. The following aircraft cannot land until the one ahead is clear of the runway. If occupancy time is longer than separation time, occupancy time becomes the limit.
landings an hour = 3,600 / the longer of the two times
At an approach speed of 140 knots, 5 nautical miles takes 129 seconds to fly and 3 nautical miles takes 77 seconds. The standard radar minimum is 3 nautical miles. It may be reduced to 2.5 on final approach only where average runway occupancy time is shown to be 50 seconds or less.11
That condition is why exits matter. An airport cannot use tighter spacing unless its aircraft clear the runway quickly.
Table 5. Landing rate by approach separation, at 140 knots
| Separation | Time between landings | Landings an hour |
|---|---|---|
| 6 nautical miles | 154 s | 23 |
| 5 nautical miles | 129 s | 28 |
| 4 nautical miles | 103 s | 35 |
| 3 nautical miles | 77 s | 47 |
| 2.5 nautical miles | 64 s | 56 |
Arrivals only. Larger gaps apply behind heavy aircraft because of wake turbulence.
5.2 Mixed mode
BIA uses its runway for landings and take-offs. In each cycle one aircraft lands and clears, then one lines up and departs. The cycle time is roughly:
arrival occupancy + departure occupancy (about 60 s) + buffer (about 20 s)
With an arrival occupancy of 98 seconds the cycle is 178 seconds, or about 40 movements an hour. With 47 seconds it is 127 seconds, or about 56 movements an hour. The second figure is close to the 55 an hour Gatwick has achieved.8
Declared capacity is normally set at 80 to 90% of these saturation figures to leave room for delay recovery.
5.3 Runway occupancy time and exit geometry
An airliner crosses the threshold at about 250 km/h (70 m/s), touches down some 450 m along the runway and brakes at about 1.5 m/s². What happens next depends on the exit.
A 90 degree exit can only be taken at about 25 to 30 km/h. The aircraft must brake almost to taxi speed on the runway, then roll on slowly to the next exit, which is rarely where it stops. With five exits on a 3,350 m runway, the average extra roll is several hundred metres.
A rapid exit taxiway leaves the runway at 25 to 45 degrees, normally 30, on a curve of at least 550 m radius. It is designed for an exit speed of 93 km/h on a runway of this class.11 The aircraft turns off while still decelerating and finishes braking on the taxiway.
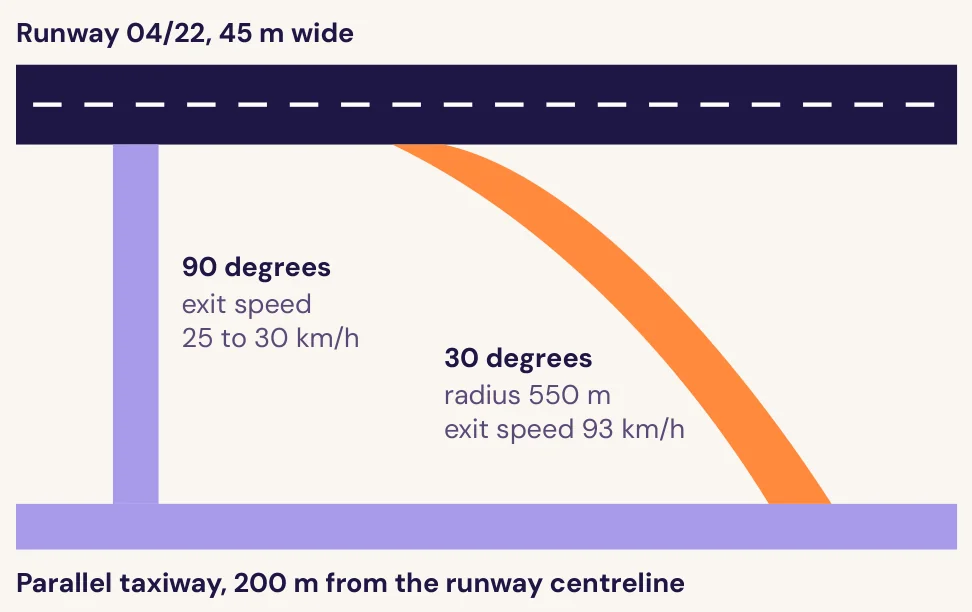
Table 6. Worked example: arrival runway occupancy time for a medium jet
| Phase | 90 degree exit | Rapid exit taxiway |
|---|---|---|
| Threshold to touchdown, and nose wheel down | 11 s | 11 s |
| Braking from 70 m/s to exit speed at 1.5 m/s² | to 7.7 m/s: 42 s | to 25.8 m/s: 29 s |
| Distance from threshold when exit speed is reached | about 2,270 m | about 2,070 m |
| Slow roll to the next exit, 400 m at 12 m/s | 33 s | none |
| Turn and clear the runway edge | 12 s | 5 s |
| Runway occupancy time | about 98 s | about 45 s |

With right-angle exits, occupancy time (98 s) is longer than the 77 s it takes to fly 3 nautical miles, so the runway and not the radar sets the landing rate. With rapid exits it falls below 50 seconds, and the tightest spacing becomes available.
5.4 Evidence from single-runway airports
Table 7. Single-runway operations compared
| Airport | Runway used | Rapid exits | Peak hour | Movements a year | Passengers |
|---|---|---|---|---|---|
| BIA, Colombo | 3,350 m | 0 | 12 to 16 (demand) | 63,000 | 10.0 m |
| Mumbai9 | 3,445 m, one of two crossing runways at a time | 4 | 51 (record) | 1,007 in a day (record) | 55.1 m |
| London Gatwick8 | 3,316 m | yes | 55 (maximum) | 265,358 | 43.2 m |
Mumbai is the closest comparison. Its two runways cross, so in practice only one is used at a time. Rapid exit taxiways built around 2012 raised its handling capacity from 32 to 44 movements an hour, a gain of 37%. It has since recorded 1,007 movements in a day.9
Gatwick‘s main runway is slightly shorter than BIA’s. Singapore Changi applies the same principle on 4,000 m runways, each with several rapid exits placed for different aircraft sizes, and handled 366,000 movements and 67.7 million passengers in 2024.10
+37%
Mumbai’s capacity gain from rapid exits9
4x
Gatwick’s movements compared with BIA, on one runway
BIA’s runway is not short of length. It is short of exits, and of the procedures that exits make possible.
5.5 Recommended airfield package

- Four rapid exit taxiways, two per landing direction: one at about 1,450 m for turboprops and narrow-body jets, one at about 2,050 m for wide-body aircraft.
- Holding bays and bypass taxiways at both runway ends so departures can be sequenced.
- Approach spacing reduced in stages to 3 nautical miles, each stage supported by a safety case.
- Airport collaborative decision making, so the tower, airlines, handlers and terminal share one set of target times.
- Slot coordination and peak pricing to spread the night and early morning waves.
- Target declared capacity: 30 movements an hour by 2028 and 44 by 2032.
6 Second runway
6.1 When it is needed
On the central scenario, peak hour demand reaches 26 to 33 movements in 2040 and 33 to 42 in 2045 (Table 4). An upgraded single runway with a declared capacity of 44 covers this until the mid 2040s. On the high scenario the limit is reached in the late 2030s.
A second runway is therefore not required for capacity before the late 2030s. It is required earlier for resilience. BIA is the country’s only long-haul runway. When it was resurfaced in 2017 it had to close for fixed daily sessions over three months.3
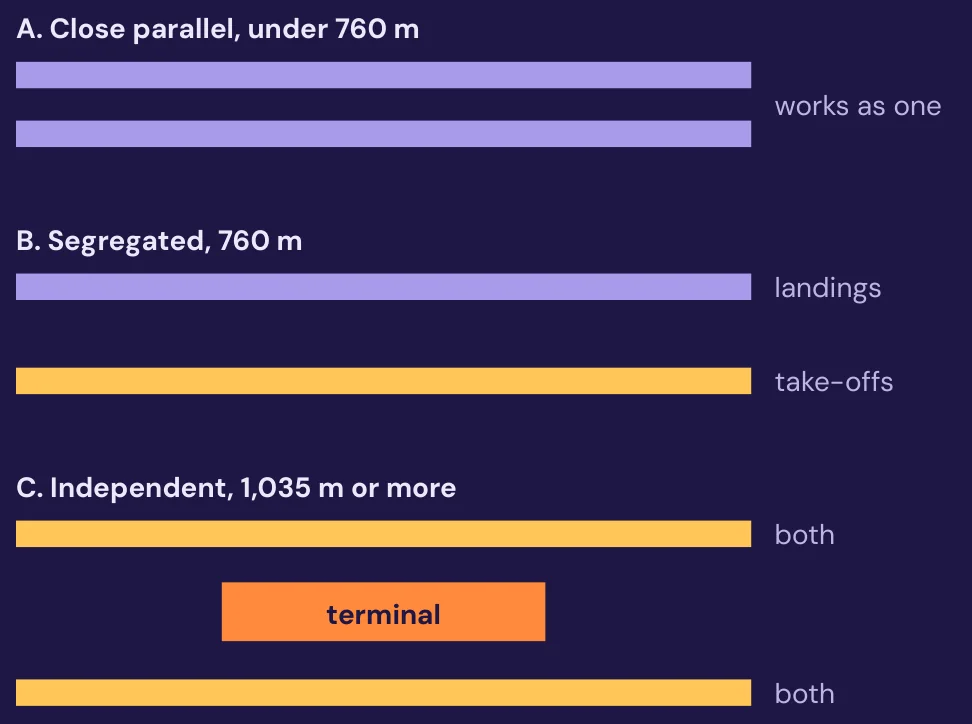
6.2 Spacing decides what a second runway is worth
The value of a parallel runway depends on its distance from the first, measured between centrelines.11
| Spacing | What it allows |
|---|---|
| Under 760 m | Dependent operations. The pair gains little over one runway. |
| 760 m or more | Segregated operations. One runway for landings, one for take-offs. |
| 1,035 m or more | Independent parallel approaches, with suitable radar and procedures. |
| About 1,500 m or more | Independent operations with room for a terminal between the runways. |
Changi’s two original runways are about 1.6 km apart, with the terminals between them.10 That layout lets both runways work at full rate and keeps taxiing aircraft from crossing a live runway.
6.3 Recommendation
- Protect a corridor now for a runway of about 4,000 m at 1,035 m or more from runway 04/22. The spacing achievable on the site must be confirmed by survey.
- Standby runway by 2030. Widen and strengthen the parallel taxiway for use as a runway when 04/22 is closed. Gatwick’s northern runway works this way and is used only when the main runway is out of service.8 At 200 m spacing the two can never be used together.
- Trigger for design: peak hour demand of 30 movements, or 20 mppa.
- Do not build a close parallel as the permanent second runway. It would add cost without adding capacity.
7 Terminal and stands

7.1 Terminal 2
Terminal 2 is planned with 8 gates and 14 passenger boarding bridges, including one gate for the A380, and is intended to raise airport capacity to about 16 mppa.1 4 5 The construction period is 30 months.4 If work resumes in 2026, opening would be in 2028 or 2029.
On the central scenario traffic reaches 15 mppa in 2032 and 16 mppa in 2033. Terminal 2 therefore provides about four years of headroom.
Table 8. Contact gates: provision and requirement
| Year | Facilities | Provided | Required |
|---|---|---|---|
| 2025 | Terminal 1 | 8 | 15 |
| 2029 | Terminals 1 and 2 | 16 | 19 |
| 2035 | With second pier | 28 | 26 |
| 2040 | With third pier | 36 | 34 |
Requirement at one contact gate per 650,000 annual passengers. Counts Terminal 2 as eight gates.
Stands are adequate in number today, 46 against a requirement of about 41, but fewer than one in five has a boarding bridge. Most passengers are therefore taken to and from the aircraft by bus.
7.2 Recommendation
Treat Terminal 2 as the first of two phases. Safeguard a second pier in the current design, with 12 contact gates by 2034 and a further 8 by 2040. Order the second pier when traffic passes 13 mppa.
8 Passenger processing and ground handling
8.1 Passenger processing
The airport has about 22 immigration counters. During 2025 the immigration computer system failed on several occasions, leaving passengers queuing for hours.5
Table 9. Proposed published service standards
| Measure | Standard |
|---|---|
| Immigration queue, 95% of passengers | under 15 minutes |
| Security queue, 95% of passengers | under 10 minutes |
| First bag on reclaim belt | under 20 minutes |
| Last bag on reclaim belt | under 40 minutes |
| International to domestic connection | 60 minutes |
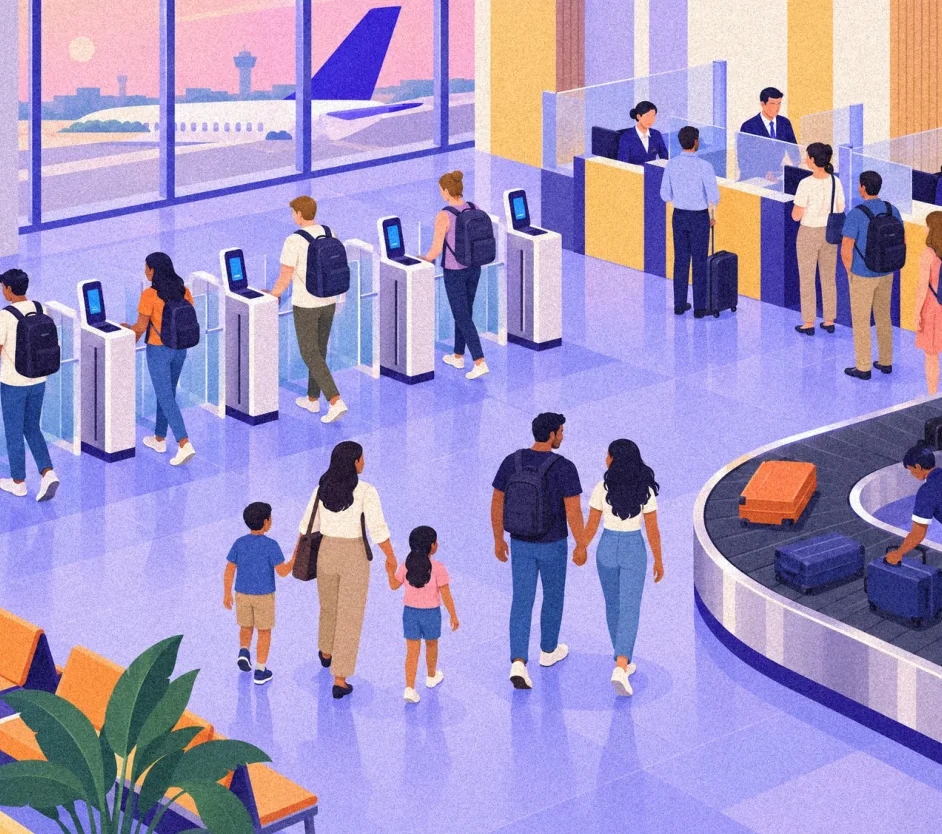
- Automated border gates for citizens and pre-cleared visitors.
- A border system with a tested offline mode.
- Off-airport check-in and bag drop in Colombo and Negombo.
- Monthly publication of performance against Table 9.
8.2 Ground handling
In 2011 SriLankan Airlines was appointed exclusive ground handler at BIA’s international terminals for ten years. In 2023 the Director General of Civil Aviation described ground handling, catering and fuel supply as state monopolies and said private providers would be invited.12
Changi licenses two ground handlers, SATS and dnata, which compete for airline contracts.10
- License a second handler by open tender before Terminal 2 opens.
- Set turnaround, baggage and equipment standards in the licence.
- Provide fixed electrical ground power at every contact gate.
- Apply open access to fuel supply and catering.
9 Surface access

9.1 Existing access
The E03 Colombo to Katunayake Expressway is 25.8 km long, opened in October 2013 and cost US$292 million, or US$11.3 million a kilometre. Its northern end is the Katunayake interchange.13
Negombo, the nearest resort town, is about 6 km from the terminal in a straight line and is reached on ordinary roads. An airport express train operated between Colombo Fort and Katunayake but was no longer running by April 2024.1
9.2 Recommendations
- Negombo link. Extend the expressway about 8 km from the Katunayake interchange to north Negombo as a four-lane dual carriageway, two lanes in each direction, the same standard as the existing expressway north of Peliyagoda.13 Indicative cost US$144 million at US$18 million a kilometre.
- Airport rail. Restore a shuttle to Colombo Fort with a journey time of about 30 minutes, timed to the arrival and departure waves, with a covered link from the station to the terminal.
- Scheduled coaches at fixed fares to Colombo, Negombo and the Kandy road.
- Kerb and forecourt capacity at Terminal 2 sized for the 2035 peak hour, not the opening year.
10 Jaffna International Airport

10.1 Existing conditions
The airport at Palaly, 13 km north of Jaffna, opened to international flights in October 2019. Runway 05/23 is about 1,400 m long and 30 m wide, which limits it to aircraft of about 75 seats.14 The wartime airfield on the site had a runway of about 2,000 m, on land of 359 acres.14 15
IndiGo operates to Chennai and Tiruchirappalli, and Cinnamon Air and DP Aviation operate domestic services. On 9 January 2026 the airport recorded seven movements in a day, its highest since reopening.14 16
A new terminal estimated at Rs 600 million has been tendered, and a business plan is being prepared. Airline development is to follow the runway extension.15
Table 10. Indicative runway length required at maximum weight
| Aircraft | Seats | Runway length |
|---|---|---|
| ATR 72-600 | 70 to 78 | about 1,300 m |
| Airbus A320neo | 180 | about 2,000 m |
| Boeing 737-800 | 180 | about 2,300 m |
| Airbus A321neo | 220 | about 2,300 m |
Typical manufacturer figures at sea level on a standard day. High temperature adds 10 to 15%. Short sectors at lower weight need less.
Table 11. Great-circle distances from Jaffna
| Destination | Distance |
|---|---|
| Tiruchirappalli | 184 km |
| Colombo (BIA) | 291 km |
| Chennai | 356 km |
| Bengaluru | 458 km |
10.2 Development options
- Runway to 2,300 m. This is the published second phase.14 It allows A320 and 737 family aircraft, which opens the major south Indian cities and Colombo at full payload.
- Use the existing airfield first. The site once held a 2,000 m runway. The extension should be designed to minimise new land take, and the land plan should be published before works begin.
- A terminal with a Jaffna identity. Sized for two narrow-body aircraft at once, with space to double it. The architecture should follow the city’s public buildings, such as the Jaffna Public Library: white walls, domes, colonnades and deep shaded verandas (Figure 10).
- Introductory charges for five years to attract airlines, as has been considered.15
- Defer the 3,200 m third phase. Long-haul passengers can connect at Chennai or BIA. The third phase carries the largest land requirement.
Table 12. Indicative capacity by stage
| Stage | Passengers a year |
|---|---|
| Present: two 78-seat flights a day each way | 114,000 seats |
| 2030: four A320 flights a day, 80% full | 420,000 |
| 2035: eight a day, plus domestic | 900,000 |
10.3 Sea links
A passenger ferry operates between Nagapattinam in Tamil Nadu and Kankesanthurai, about 108 km. In October 2025 the two governments discussed a second route between Rameswaram and Talaimannar, about 49 km.17
- Northern interchange. A timed shuttle linking Kankesanthurai port, Palaly airport and Jaffna railway station, which lie within about 20 km of each other.
- Through ticketing between ferry, flight and rail.
- The same border standard at ferry terminals as at airports.
- Talaimannar opened together with a rail connection to Colombo.
A caution
Mattala has a 3,500 m runway and a terminal for 1 million passengers a year, and has carried a small fraction of that.18 Each stage at Jaffna should follow demonstrated demand.

11 National network
A visitor who lands at BIA and is bound for Jaffna, Trincomalee or the east coast faces six to nine hours by road. Domestic air service is thin, and scheduled operations have been hard to sustain.
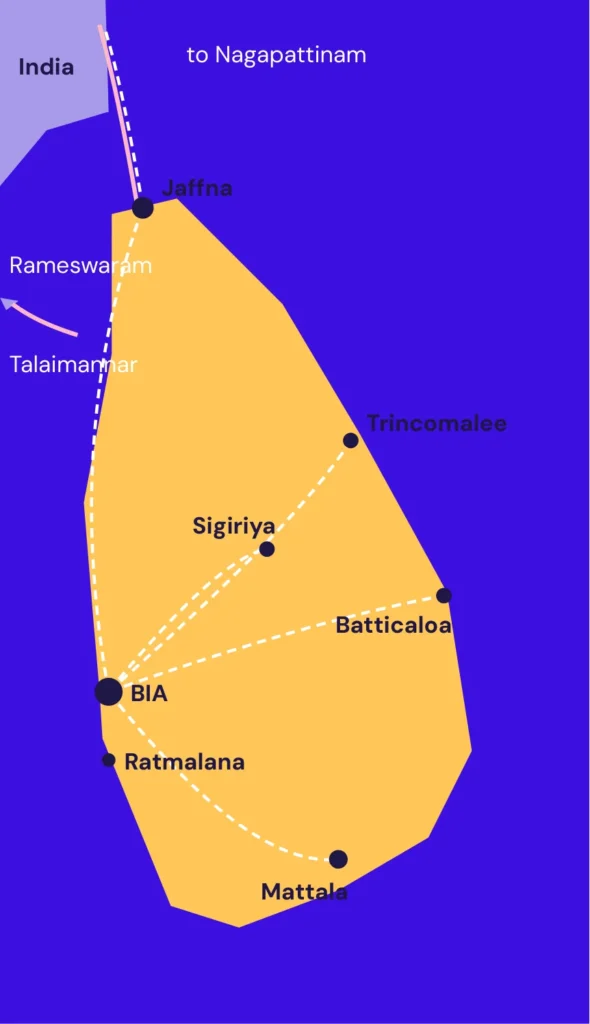
Table 13. Proposed role of each airport
| Airport | Role |
|---|---|
| BIA | International hub. Its domestic terminal becomes the transfer point for the island. |
| Jaffna | Northern gateway. India and regional flights, shuttle to BIA. |
| Mattala | Seasonal charters for the south and east, diversion airport, cargo and maintenance. |
| Ratmalana | City airport for business aviation, training and small aircraft. |
| Trincomalee, Batticaloa | East coast, served by 70-seat turboprops from BIA. |
| Sigiriya, Hingurakgoda | Cultural triangle. Develop one fully before the other. |
The 2026 budget allocates Rs 1 billion to domestic airports at Sigiriya and Trincomalee and expects Hingurakgoda to be completed in 2026.6 Foreign airlines have been eligible for domestic licences since 2019.19
- Timed connections. Domestic departures about 90 minutes after the main arrival waves.
- Time-limited route support, tendered per seat for three years.
- Single-ticket journeys with baggage checked through.
12 Phasing and cost
Table 14. Development phases and triggers
| Phase | BIA | Network |
|---|---|---|
| 2026 Decisions | Approve airfield package. Gazette second runway corridor. Tender second ground handler. Begin publishing service standards. | Publish Jaffna land plan. Agree northern interchange. Select Sigiriya or Hingurakgoda. |
| 2027 to 2028 Airfield | Construct rapid exits and holding bays in night closures. Stage approach spacing reductions. Automated border gates. Rail shuttle restored. | Jaffna runway extension. Timed domestic connections. Through ticketing with the ferry. |
| 2029 to 2030 Terminal 2 | Terminal 2 opens with two handlers. Standby runway commissioned. Second pier designed. | Narrow-body services at Jaffna. Negombo link under construction. |
| 2031 to 2035 Growth | Second pier, 12 gates. Trigger: 13 mppa. Declared capacity 44 an hour. | Negombo link open. Jaffna terminal expanded if warranted. |
| After 2035 Second runway | Design begins. Trigger: 30 peak hour movements or 20 mppa. | Mid-field terminal planning. |
Table 15. Order-of-magnitude cost, 2026 to 2035
| Item | US$ million |
|---|---|
| Four rapid exit taxiways, holding bays, lighting | 45 |
| Air traffic systems, surface surveillance, shared data | 25 |
| Standby runway from the parallel taxiway | 120 |
| Second pier, 12 contact gates | 250 |
| Border automation, baggage, domestic transfer | 30 |
| Negombo expressway link, 8 km, four lanes | 144 |
| Rail shuttle and coach interchange | 15 |
| Jaffna runway to 2,300 m, apron, lighting | 60 |
| Northern interchange and ferry terminal works | 10 |
| Domestic route support, three years | 15 |
| Contingency, 20% | 143 |
| Total | 857 |
US$6
Per passenger, over the 136 million passengers forecast for 2026 to 2035
The first two items, US$70 million, are 8% of the total and deliver the runway capacity gain.
Excluded: Terminal 2, which has its own loan, and the second runway.
All costs are planning assumptions, not estimates from design.
13 Risks and recommendations
Table 16. Principal risks
| Risk | Mitigation |
|---|---|
| Airfield works disrupt operations | Night closures in fixed sessions, as in 2017. One exit at a time. |
| Reduced separation not approved | Staged introduction with a safety case, simulation and independent review. |
| Terminal 2 delayed again | Airfield package and service standards proceed independently. |
| Second runway corridor lost to development | Gazette in 2026. This cannot be recovered later. |
| Land dispute at Jaffna | Design within the existing airfield first. Publish the land plan. Compensate before possession. |
| Overbuilding at Jaffna | Stage by demonstrated demand. |
| Resistance to a second handler | Incumbent retained as one of two licensees, with a transition period. |
| Traffic below forecast | Trigger-based investment. No major item is ordered before its trigger. |
Recommendations
- R1 Commission a runway capacity study and build four rapid exit taxiways by 2028.
- R2 Reduce approach spacing in stages. Declare 30 movements an hour by 2028 and 44 by 2032.
- R3 Gazette a second runway corridor at 1,035 m or more from runway 04/22.
- R4 Convert the parallel taxiway to a standby runway by 2030.
- R5 Safeguard a second pier in the Terminal 2 design: 12 gates by 2034, 8 more by 2040.
- R6 Publish passenger service standards monthly.
- R7 License a second ground handler before Terminal 2 opens.
- R8 Extend the expressway to Negombo as a four-lane road and restore the airport rail shuttle.
- R9 Extend the Jaffna runway to 2,300 m, within the existing airfield as far as possible, with a terminal designed in the Jaffna tradition.
- R10 Create a northern interchange linking the port, the airport and the railway.
- R11 Make BIA’s domestic terminal the island’s transfer point, with timed connections.
- R12 Tie every large investment to a traffic trigger, not a calendar date.
Appendix A: Calculations and assumptions
| Item | Basis | Result |
|---|---|---|
| 2025 passengers | 8,804,019 x (6,630,728 / 5,837,351)1 2 | 10.0 million |
| 2025 movements | 55,848 x 1.136, same growth as passengers1 | about 63,000 |
| Passengers per movement | 8,804,019 / 55,848. Assumed to rise to 175 by 2045 | 158 |
| Growth, 2012 to 2018 | (10,798,669 / 7,145,091) to the power 1/6 | 7.1% a year |
| Forecast | 10.0 x (1 + rate) to the power of years after 2025 | Table 3 |
| Year central reaches 15 mppa | log(15 / 10) / log(1.055) = 7.6 years | 2032 |
| Peak hour | Average day / 14 (spread) and / 11 (peaked) | Table 4 |
| Contact gates | Annual passengers / 650,000. Gatwick operates near this ratio | Table 4 |
| Stands | Peak hour arrivals x 1.5 h turnaround x 1.25, plus 26 for based and overnight aircraft | Table 4 |
| Time to fly a separation | Distance / 72 m/s (140 knots). 3 NM = 5,556 m | 77 s |
| Braking distance | (v1² – v2²) / (2 x 1.5 m/s²), from 70 m/s | Table 6 |
| Braking time | (v1 – v2) / 1.5 m/s² | 42 s and 29 s |
| Distance at exit speed | 450 m to touchdown + 210 m transition + braking distance | 2,270 m and 2,070 m |
| Mixed-mode saturation | 3,600 / (arrival occupancy + 60 + 20) x 2 | 40 and 56 an hour |
| Mumbai gain | 44 / 329 | +37% |
| India’s visitor share | 531,511 / 2,362,5217 | 22.5% |
| Distances | Great-circle between airport reference points | Table 11 |
| Jaffna present seats | 2 x 78 x 2 x 365 | 113,880 |
| Jaffna 2030 | 4 x 180 x 2 x 365 x 0.8 | 420,480 |
| Negombo link | 8 km x US$18 m. E03: 292 / 25.8 = 11.313 | US$144 m |
| Programme cost | 714 x 1.2 | US$857 m |
| Cost per passenger | 857 / 135.8 million passengers, 2026 to 2035, central | US$6.3 |
Limitations
The worked runway occupancy example uses a constant deceleration and a single aircraft type. Real values vary with aircraft, weight, wind, surface condition and pilot technique, and should be measured on site. BIA’s present declared capacity and approach spacing are not published and are not assumed here. Rapid exit positions, second runway spacing and all costs require engineering study.
Appendix B: References
- Bandaranaike International Airport. Wikipedia, citing Airport and Aviation Services (Sri Lanka) and Civil Aviation Authority statistics. Passengers and movements 2012 to 2024, stands, gates, Terminal 2, rail service.
- Aviation Voice, 2025. “Bandaranaike International Airport records 14% passenger growth in first eight months of 2025”.
- Engineers’ association of Airport and Aviation Services. “Runway overlay and associated works at Bandaranaike International Airport, Katunayake”. Runway and taxiway geometry, lighting, 2017 working sessions.
- The Morning, 9 March 2025. “BIA Terminal II: tenders to close, bids open by end of March”.
- Daily Mirror, 30 May 2025. “Will delays in completing airport terminal 2 cause major losses?”.
- Sunday Times, 9 November 2025. Budget 2026: airport upgrades and tourism.
- Daily FT, January 2026. “Tourism arrivals grow by 15% to 2.36 m record high in 2025”.
- Gatwick Airport. Wikipedia, citing UK Civil Aviation Authority data. Runway, traffic 2024, peak hourly movements, standby runway.
- Chhatrapati Shivaji Maharaj International Airport, Mumbai. Wikipedia. Runways, rapid exit taxiways, capacity before and after, movement records, traffic 2024-25.
- Singapore Changi Airport. Wikipedia and Changi Airport Group publications. Runways, traffic 2024, ground handlers.
- International Civil Aviation Organization. Annex 14, Aerodromes, Volume I. Doc 9157, Aerodrome Design Manual, Part 2. Doc 4444, Procedures for Air Navigation Services: Air Traffic Management. Doc 9643, Simultaneous Operations on Parallel or Near-Parallel Instrument Runways.
- Lanka Business Online, 24 May 2011. Counterpoint, 16 July 2023. Ground handling arrangements at BIA.
- E03 Colombo to Katunayake Expressway. Wikipedia.
- Jaffna International Airport. Wikipedia.
- The Morning, 24 August 2025. “Jaffna International Airport: business plan for expansion due in eight months”.
- Travel Talk Asia, 9 January 2026. Record daily movements at Jaffna International Airport.
- Ada Derana, 28 October 2025. “Sri Lanka, India discuss new ferry route between Talaimannar and Rameswaram”.
- Mattala Rajapaksa International Airport. Wikipedia.
- ch-aviation, 9 November 2019. “Sri Lanka permits foreign airlines to fly domestic services”.
Standards under reference 11 are cited from their published provisions. Figures described as illustrations are artist’s impressions, not survey drawings.
An independent proposal. Not issued by or on behalf of any ministry, authority, airport or airline.